Vacuum Gauge Analytics & Displays – Vacuum Gauge Data Made Useful
Traditionally, the vacuum gauge industry has manufactured gauges that provide measurement at a point in time, but has not provided an analysis of what several measurements mean given the task at hand. Yea, it was definitely time for some innovation here! To do this, measurement data must be collected, stored and analyzed (on a network or Smart Phone) to open the door for using analytics. Instrumentation analytics from a digital vacuum gauge enable you to observe trends, make faster and more reliable conclusions and use set points to turn on/off a machine (the latter is a vacuum control process). Finally, this data needs to be displayed in a useful format, so the presentation of this data is important too. Oh, and you need a really cool manufacturer who’s got the passion and the brains to make it happen.
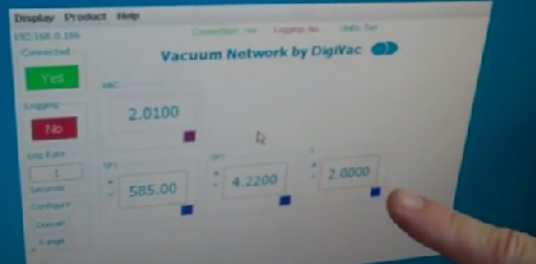
A good example of this is the StrataCapture software (provided with any StrataVac controller purchased with an ethernet option). This web-based software allows you to see all of your vacuum information, and, in the case of the digital vacuum gauges Stratavac and Stravac/3CM, all of the connected sensors, change set points and PID variables. To try out vacuum analytics without a digital vacuum gauge, try this stand-alone simulation applet. Using a Java-enabled browser, you can click, download, run and interact with this software without first purchasing an Ethernet-enabled instrument. The applet randomly assigns sensor values between the SP1 and SP2 set points.
Using technology, sophisticated engineering and practical application, connected products can be created with the precision and accuracy you must have to get the job done right.
Have a question?
We would love to provide you with fast, useful information to make your job easier!

